Underwriting insights for alternative lenders

Practical guides on documents, bank statements, verification, fraud and policy for lending teams.

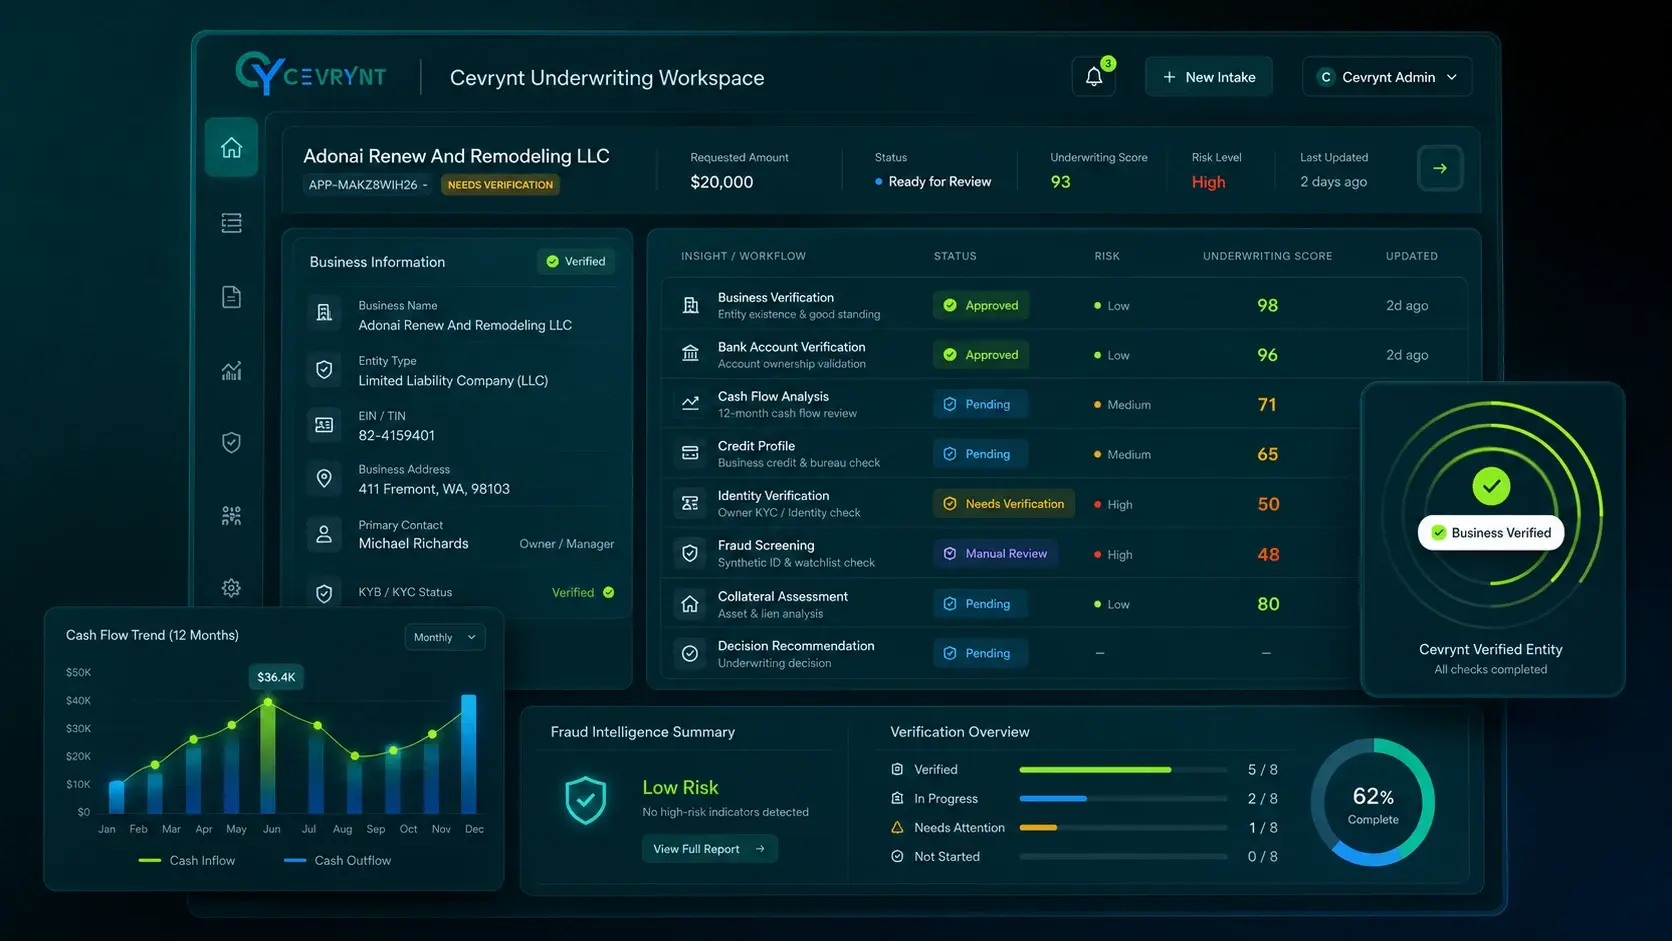
Illustrative Cevrynt underwriting workspace showing business verification, cash-flow analysis, fraud review, and underwriting status
01

Newest first

The newest article leads. The six before it run down the rail beside it.

Set the way a front page is: one lead in its own words, with the product view that matches it, and what came before it in date order.

32
Articles published
08
Topics they cover
231
Minutes of reading in all
00
Behind a sign-up form

Why the newest article leads on its own

A blog index that opens on a grid of equal cards asks the reader to do the sorting. This one opens the way a front page does: the newest article, set large in its own words, and the six before it on a dated rail so it is clear what is recent and what came before.

The picture beside the lead is the product view for the part of Cevrynt the article relates to, chosen from the article's own links rather than by hand — so the page stays right when a newer article takes the lead.

How the front page is set

  1. The leadThe newest article
  2. The railThe six before it
  3. The pictureIts related product
  4. UpdatedOn publish

Articles are general perspectives on underwriting practice for lending teams. They are not legal, compliance or credit advice, and product views are illustrative, on synthetic data.

One lead, six before it, and nothing typed by hand: publish a new article and it takes the lead, with the picture that matches it.

Dates, topics and reading times come from each article. Reading times are the estimates shown on the articles themselves.
02

The archive

Every article, on the day it was published, with each month's list beneath it.

One strip per month and one mark per article. Search, or choose a topic, to see when it was covered; every title below is a link.

32
Articles
05
Months of publishing
4.7
Days between articles, on average
32
Showing now

32 articles

  1. September 20264 articles

  2. August 20263 articles

  3. July 20268 articles

  4. June 20268 articles

  5. May 20269 articles

Why the archive is a calendar

A grid of identical cards hides the one thing an archive can show at a glance: how the writing has actually been published. Laid on a calendar, each month's marks show the rhythm — and choosing a topic shows when that subject was covered, not just that it was.

Nothing is hidden by the design. Every article is listed under its month, newest first, with its topic and reading time, and every title is a link.

Reading the calendar

  1. A markOne article, on its day
  2. A stripOne month
  3. A topicLights its marks
  4. Every titleA link

For a guided start rather than a date order, the resources page shelves these same articles by workflow stage and lays out reading routes by role.

32 articles over 5 months, one every 4.7 days on average — each on the day it was published, and each a click away.

Dates are each article's publication date. Topics are the categories the articles are filed under.
03

Where the article ends and the product begins

Every article, section by section. The one about Cevrynt is short, and always last.

Each bar is an article divided into its sections by length, with the Cevrynt section in amber — so how much of this blog is a pitch is visible at a glance.

32
Articles
32
End with one Cevrynt section
9%
Of an article, on average
00
Where Cevrynt comes earlier

A section of general guidanceThe section about Cevrynt

Every bar is one article, start to finish

Each article is divided into its sections by length. Point at one to see its Cevrynt section by name; choose it to jump straight to that section in the article.

Why the blog shows how much of it is a pitch

The fair question to ask of any vendor's blog is how much of it is selling. So the answer is drawn for every article at once: each bar is one article split into its sections, and the one section about Cevrynt is drawn in amber.

In every article it is a single section, it is always the last, and on average it runs to under a tenth of the whole. Everything before it is general guidance that stands on its own whether or not you ever speak to us — which is why the amber lines up in one narrow column at the right-hand edge.

How the bars are measured

  1. A segmentOne section
  2. Its widthIts share of the words
  3. AmberThe Cevrynt section
  4. MeasuredFrom the article

Section lengths are counted from each article's own text, including lists and callouts. Frequently asked questions and related links after the article are not included.

32 articles, one Cevrynt section each, always last. The guidance comes first and stands on its own.

Counted from the published text of each article. Articles are general perspectives on underwriting practice, not legal, compliance or credit advice.
04

By topic

Eight topics, each with its own desk: the brief, the articles, and where it becomes product.

Choose a topic to see everything filed under it, with the product view that matches it where one does.

08
Topics
03
With a matching product view
32
Articles filed under them

Topics

Why some desks have a picture and some do not

A topic page is where a blog is usually read the old way: pick a subject, see everything written about it. Each desk here gives the subject in a line, every article filed under it, and the page on this site where the topic turns into product.

Three topics have an illustrative product view that genuinely shows what they are about. The others get a typeset plate instead of a borrowed picture — an image that did not match its topic, or contradicted the rest of the site, would be decoration pretending to be evidence.

What a desk holds

  1. The briefWhat the topic covers
  2. The articlesNewest first
  3. The pictureOnly if it matches
  4. The linkWhere it becomes product

Solutions articles are written for particular kinds of lender or seller, so their desk has no single product page; each article links to the ones it relates to.

Eight topics, each with its own desk, and a picture only where the picture is true to the topic.

Product views are illustrative, on synthetic data. Topics are the categories the articles are filed under.
05

Founder-led

See what these articles look like on your own files.

If an article describes a problem your team knows well, a walkthrough shows how Cevrynt handles it — against your criteria, with your underwriters making every decision.