
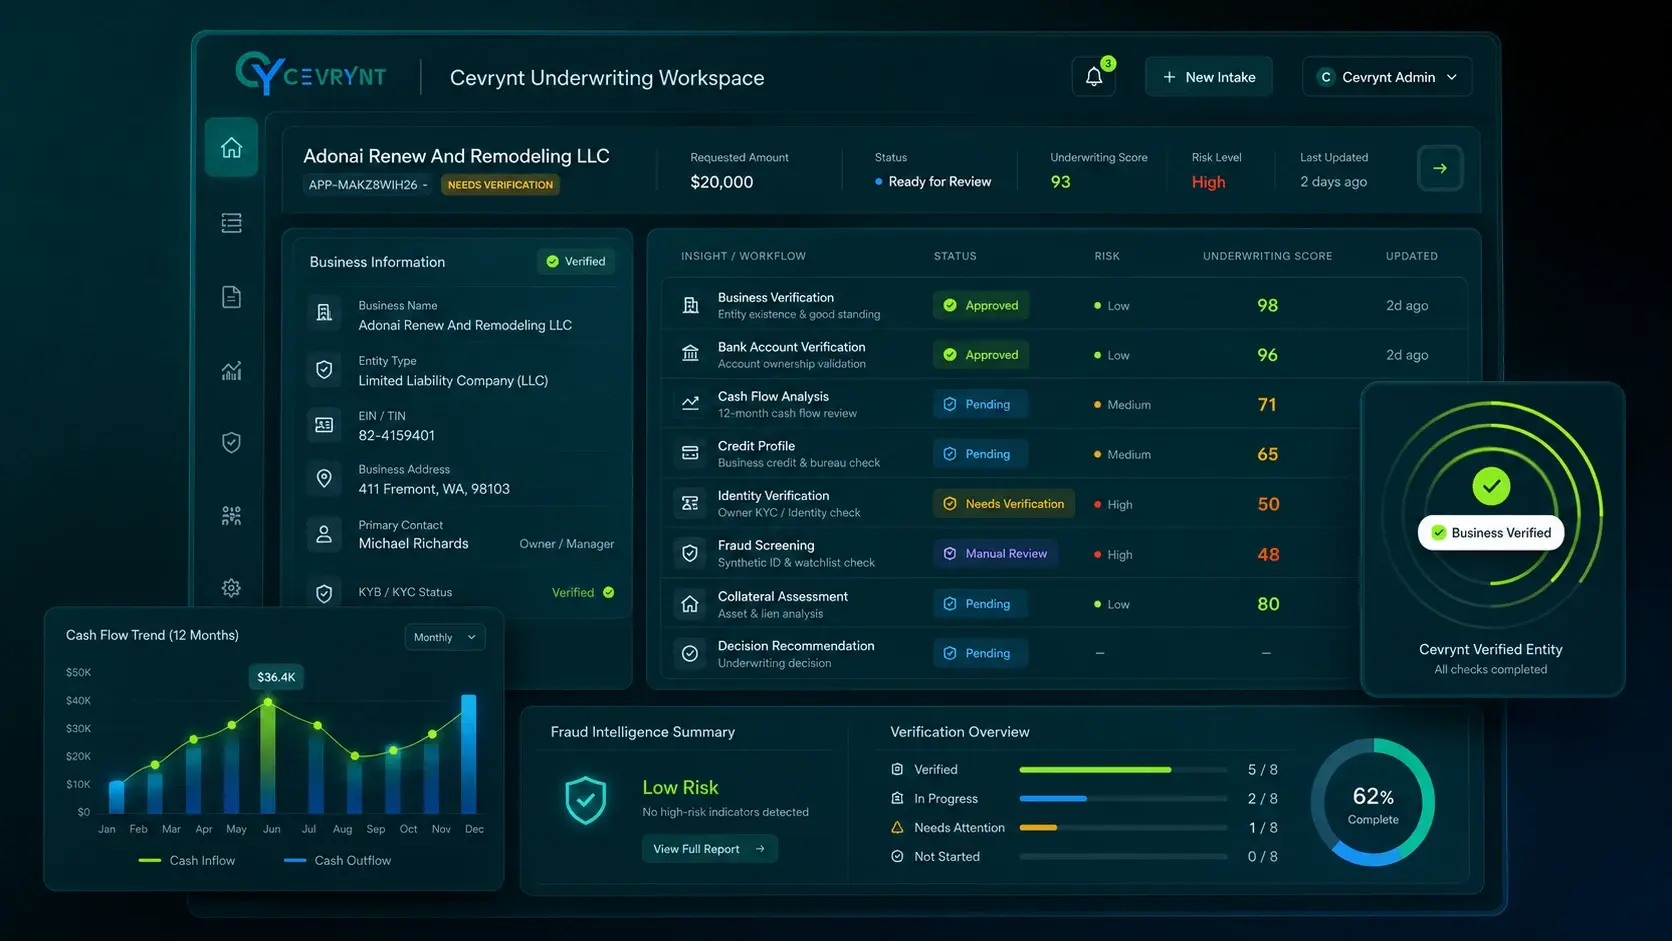
Non-sufficient-funds (NSF) events and overdrafts show up in almost every bank statement analysis workflow as a headline risk metric, and for good reason — they are one of the more direct signals of cash flow stress available in transaction data. But treating NSF count as a single number to compare against a threshold misses most of what actually makes this signal useful. Context, trend, and cause matter as much as raw frequency.
What an NSF event actually indicates
An NSF event occurs when an account doesn't have enough funds to cover a transaction, resulting in either a returned payment or an overdraft fee. At a basic level, this indicates the business's cash position was, at that specific moment, insufficient to meet an obligation. A single isolated event, on its own, tells an underwriter relatively little — businesses occasionally mistime a payment even when fundamentally healthy.
The signal strengthens considerably when NSF events form a pattern: recurring monthly, clustering around specific dates, or increasing in frequency over the lookback period.
Reading NSF data correctly
Trend matters more than total count
A business with six NSF events spread evenly across six months tells a different story than one with zero events in the first three months and six in the last month alone. The second pattern suggests deteriorating conditions; the first might reflect a chronic but stable operating style. Comparing only total counts across deals can obscure this distinction entirely.
Clustering around specific obligations
NSF events that consistently occur around the same recurring debit — often a daily or weekly ACH payment — can point to an existing obligation, such as an MCA advance, that is straining cash flow more than the business can comfortably absorb. This pattern is worth cross-referencing against the debt-service analysis discussed in our guide to cash flow underwriting, and can be an early indicator of the kind of overextension covered in our piece on detecting stacking.
Industry and seasonal context
Some industries and business models run tighter cash positions as a normal course of operation. Reading NSF frequency without any industry context risks penalizing businesses that operate this way sustainably, while under-weighting the same frequency in an industry where it would be genuinely unusual.
What recovery behavior after an NSF event reveals
The period immediately following an NSF event is often as informative as the event itself. A business that experiences a returned payment on Monday but brings its account current by Wednesday — a next-day deposit covers the gap — is demonstrating fundamentally different financial management than a business whose balance stays negative for five consecutive days before recovering. Both show an NSF event in a raw count, but the risk profiles are quite different.
Extended negative balance periods after NSF events suggest the business doesn't have a reliable source of funds to draw on when cash flow misses — no cash reserve, no line of credit, no reliable incoming deposit that will clear the shortfall quickly. Short, sharp events with immediate recovery suggest occasional timing mismatches rather than structural cash flow deficiency.
For MCA underwriting specifically, recovery behavior matters because MCA repayment typically continues during low-balance periods. A business that can't bring its account current quickly after an NSF event while a daily MCA debit continues to pull is in a compounding negative spiral that often ends in payment default.
The difference between occasional and structural NSF patterns
Occasional NSF events — one or two over a six-month lookback period, not clustering around a specific obligation, followed by quick recovery — are generally viewed as noise in an otherwise healthy file. They may reflect a banking timing mismatch (a payroll pull hitting before a large client deposit clears), a one-time expense, or simply a routine management imprecision that doesn't reflect ongoing cash flow stress.
Structural NSF patterns are something quite different. These appear monthly or more frequently, often around the same dates, and often around the same recurring debit obligations. The business is consistently running too close to zero to comfortably absorb its fixed obligations — a pattern that is likely to get worse, not better, if additional debt service is added. This is the pattern most directly relevant to underwriting risk, and it's also the one most likely to be missed if analysis only surfaces a total NSF count.
What NSF events look like alongside MCA-style repayment obligations
For MCA underwriting specifically, the most concerning NSF pattern is one that clusters tightly around existing ACH debit obligations. Consider a business with a $950 daily ACH pull tied to an existing advance. In the statements, you observe: on the 3rd of each month, balance drops to $220; a $950 pull hits; the item is returned NSF; a deposit arrives two days later; the pull re-initiates and clears. This pattern repeats in months four and five, and NSF fees accumulate on top.
What's described above is not just a bad NSF metric — it's a business that is already failing to service a single existing advance comfortably. Adding a new advance with its own daily repayment obligation into this picture would almost certainly accelerate default rather than help the business. No single threshold catches this if the NSF count happens to be low; only pattern analysis that connects timing, amount, and recurring debit identity surfaces it clearly.
How NSF data fits into the broader underwriting picture
NSF pattern analysis is most useful when reviewed as one dimension of a connected financial picture, not as a standalone gate. The other dimensions complement it directly: average daily balance shows typical operating cushion; deposit consistency shows revenue stability; existing debt-service analysis (discussed in our guide to cash flow underwriting) shows how much of the cash flow is already committed. Together, these tell a coherent story about whether additional debt service would represent a manageable addition to a healthy business or a further strain on an already-stretched one.
The practical implication is that an underwriting workflow shouldn't evaluate NSF data as a separate check — it should produce NSF findings as part of the same analysis that produces ADB trends and existing-obligation identification, so the underwriter reads them together rather than as independent facts. A business with two NSF events, a declining ADB trend, and a high existing debit burden is a very different risk than a business with the same two NSF events, a stable ADB, and no identified existing obligations.
Where NSF analysis can mislead if done poorly
- Treating a single threshold as universal — a fixed "more than X NSF events = decline" rule ignores trend, timing, and context that matters more than the raw count.
- Missing the distinction between bank-initiated overdraft coverage and outright returned items, which can carry different risk implications depending on the bank's own policies.
- Failing to link flagged events back to the actual statement lines, leaving an underwriter unable to quickly verify what a summary count actually represents. This is why source-linked extraction matters even for a metric that seems purely numerical.
- Ignoring recovery patterns — a business that experiences NSF events but consistently brings its balance current within days behaves differently than one where negative balances persist.
From here, this article is about Cevrynt
How Cevrynt surfaces NSF patterns
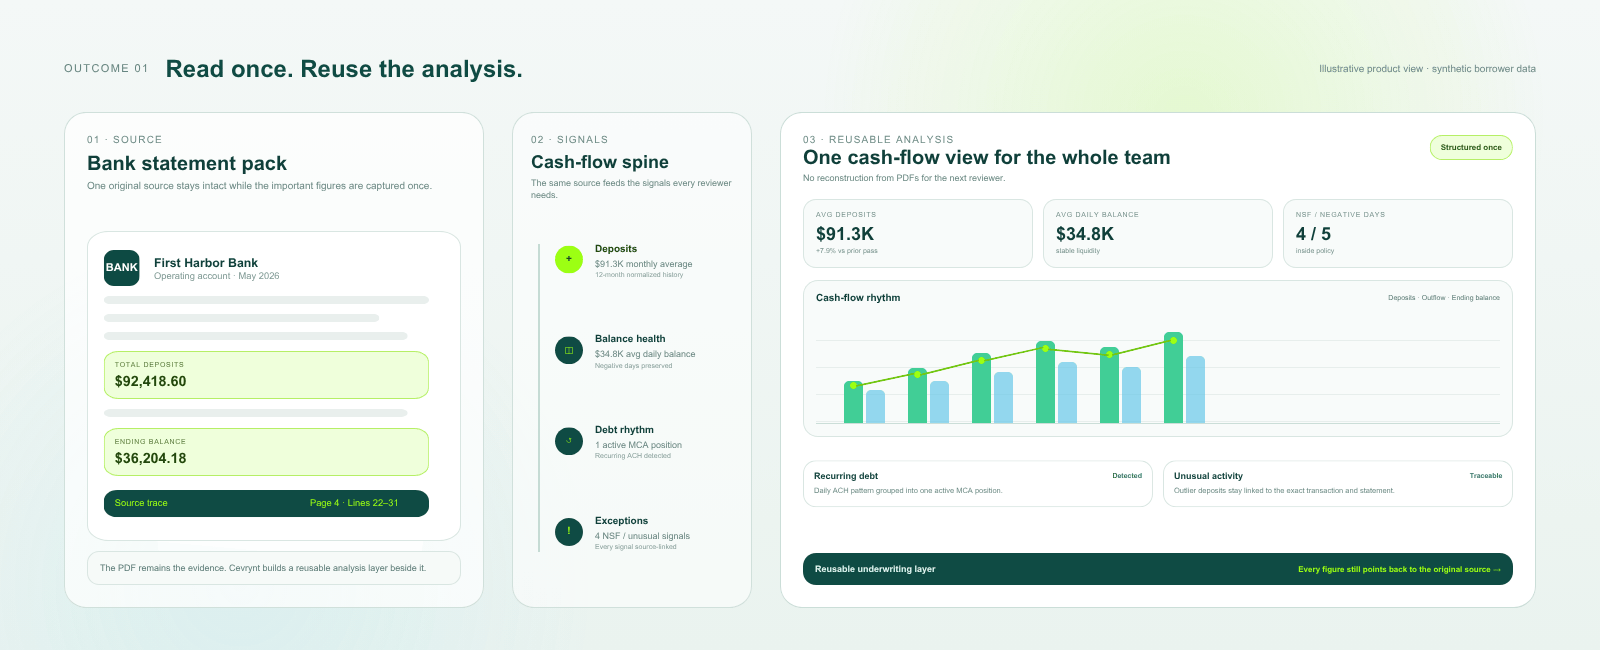
Cevrynt's Bank Statement Analysis surfaces NSF and overdraft activity as a trend over the full lookback period, not just a raw count, and links every flagged event back to its exact transaction line. This gives underwriters the context needed to distinguish a stable, if elevated, baseline from genuinely deteriorating conditions — a distinction that a single threshold-based score would miss.
This analysis sits alongside deposit trends, average daily balance, and existing debt-service detection, so NSF patterns are read in the context of the full financial picture rather than in isolation. A qualified walkthrough shows how this looks against a representative file.