
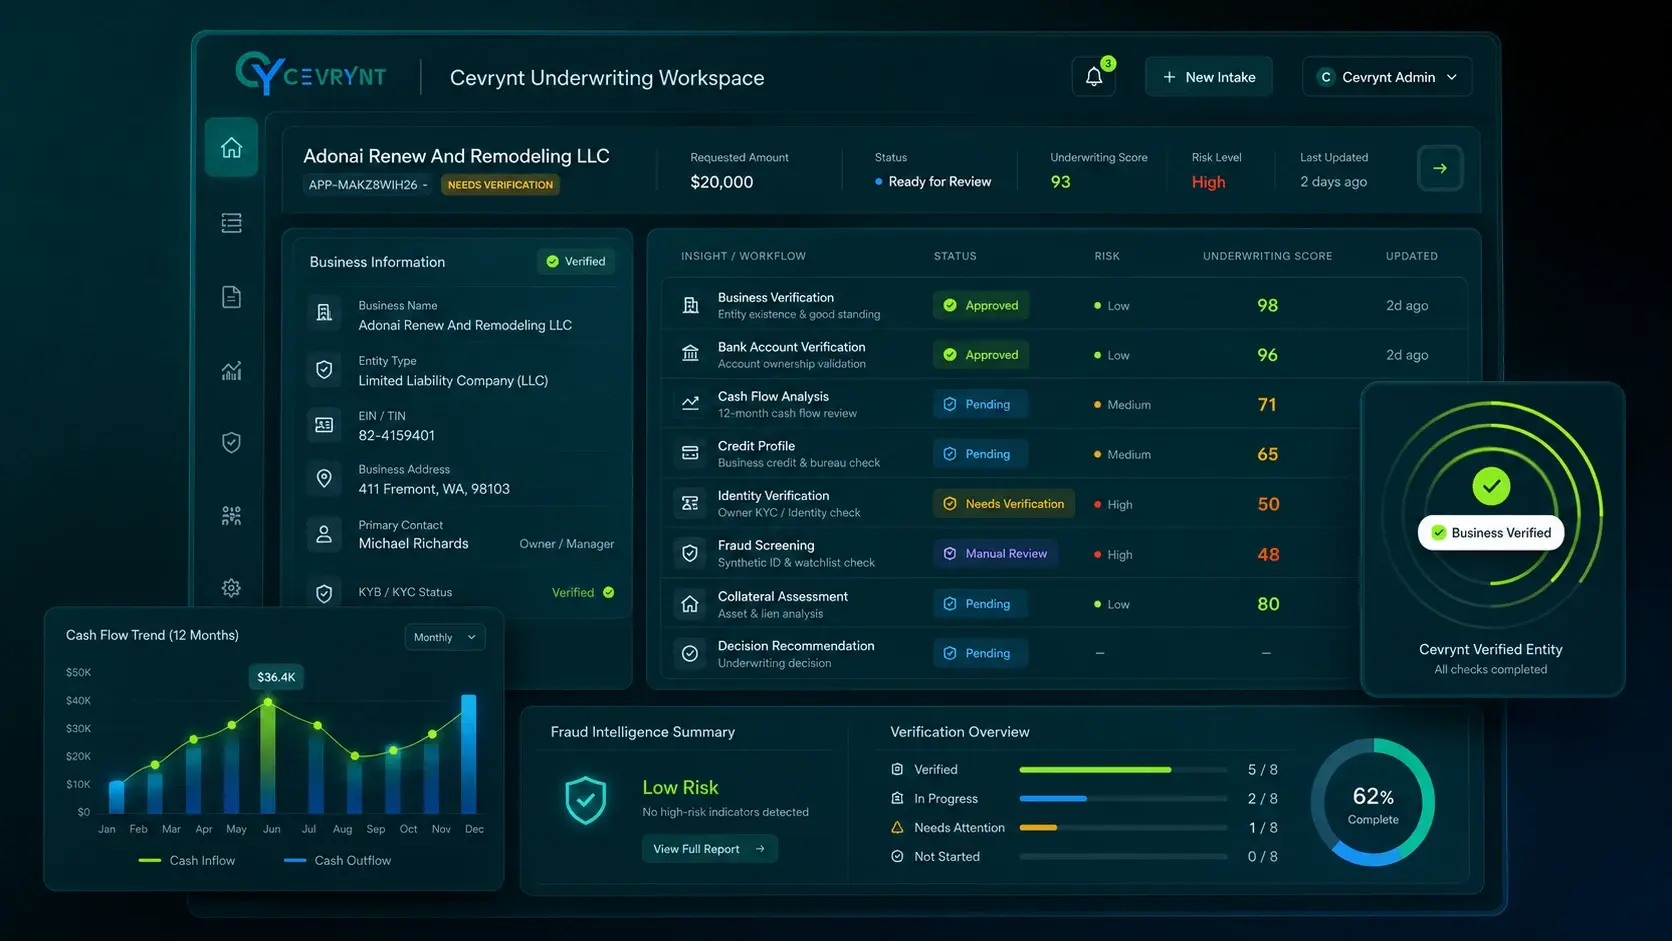
For most alternative lenders, bank statements carry more underwriting signal than almost any other single document a borrower submits. Tax returns are backward-looking and often stale by the time they're filed. Credit bureau data reflects personal or business credit history, not current operating reality. Bank statements show what is actually happening in the business right now — deposits, expenses, timing, and stress patterns — which is exactly what matters for a merchant cash advance or short-term working capital decision.
This guide walks through what bank statement analysis actually involves, which metrics matter most, and how to think about building or buying a system to do it well.
What bank statement analysis actually produces
At a basic level, bank statement analysis takes raw transaction data — often three to six months of statements — and turns it into structured, comparable metrics: total deposits, deposit consistency, average daily balance, overdraft and NSF activity, existing debt service, and category-level spending patterns. The goal is turning a stack of PDFs into a small number of numbers an underwriter can compare across deals on a like-for-like basis.
The core metrics underwriters rely on
Deposit volume and consistency
Total monthly deposits give a rough proxy for revenue, but consistency matters as much as volume. A business depositing a steady $40,000 a month tells a different story than one bouncing between $10,000 and $70,000, even if the average is similar. Consistency is often a better predictor of repayment capacity than raw volume alone.
Average daily balance
Average daily balance (ADB) reflects how much operating cushion a business typically holds. A business with strong revenue but consistently low ADB may be running tight on cash despite healthy top-line numbers — a pattern that raw deposit totals alone would miss entirely. Our dedicated piece on DSCR and average daily balance covers how these metrics are typically calculated and interpreted.
NSF and overdraft frequency
Non-sufficient-funds events and overdrafts are one of the clearest stress signals available in bank statement data. A rising trend in NSF frequency, in particular, often precedes broader repayment difficulty. See our detailed guide on NSF patterns and what they tell underwriters.
Existing debt service
Recurring debits to other lenders — daily or weekly ACH debits characteristic of existing MCA positions — reveal whether a business is already carrying advances that would compete with a new one for the same cash flow. Missing this is one of the more consequential blind spots in manual review, and it connects directly to the risk of stacking.
Cash flow trend over the lookback period
A single snapshot number hides direction. Is deposit volume growing, flat, or declining across the statement period? A business with weaker absolute numbers but a clear upward trend may represent a very different risk profile than one with stronger numbers on a downward trajectory.
How underwriters use these metrics together
No single metric tells the full story on its own. A useful bank statement analysis workflow presents these figures together, with enough context for an underwriter to weigh them against the specific deal — the requested amount, the industry, and the lender's own credit policy. This is where cash flow underwriting for SMB loans as a broader discipline comes in, connecting these individual metrics into an actual credit judgment.
What to look for when evaluating a bank statement analysis tool
- Coverage across bank formats. Statement layouts vary widely; ask how the tool handles less common banks and credit unions, not just the largest national institutions.
- Category accuracy for recurring debits. Correctly identifying existing MCA or loan payments among general expenses is one of the harder classification problems — ask for specifics.
- Evidence links, not just summary numbers. Every metric should trace back to the specific transactions behind it, per our guide on source-linked extraction.
- Configurable lookback periods and thresholds, since different lenders and loan products require different analysis windows and risk tolerances.
- How anomalies are flagged, not just averaged away — a single large one-time deposit can distort a simple average in misleading ways.
How the analysis window affects what you see
The length of the statement lookback period has a direct effect on which patterns become visible. A one-month window might catch a recent NSF cluster but miss a slower six-month revenue decline entirely. A six-month window captures more of the business's genuine trend but can also dilute a recent, meaningful change in circumstances by averaging it against older, less relevant history. There's no universally correct window length — the right choice depends on the loan product, the deal size, and how much weight a lender wants to place on recent versus historical performance.
Some lenders address this by reviewing multiple windows simultaneously — a shorter recent window for immediate risk signals, alongside a longer window for overall trend — rather than committing to a single fixed lookback period across every deal.
Bank statement analysis for renewals, not just new applications
Bank statement analysis is often discussed purely in the context of new applications, but it plays an equally important role in renewal decisions for lenders offering repeat financing to existing borrowers. A renewal review should compare the current statement period against the borrower's performance during the prior advance, looking specifically for deterioration that wouldn't be visible from a single snapshot — declining deposit trends, new NSF activity that wasn't present previously, or new recurring debits suggesting an additional financing position taken on since the last advance. Treating a renewal with the same rigor as a new application, rather than as a formality, is one of the more consistent gaps in less mature underwriting operations.
From here, this article is about Cevrynt
How Cevrynt structures bank statement analysis
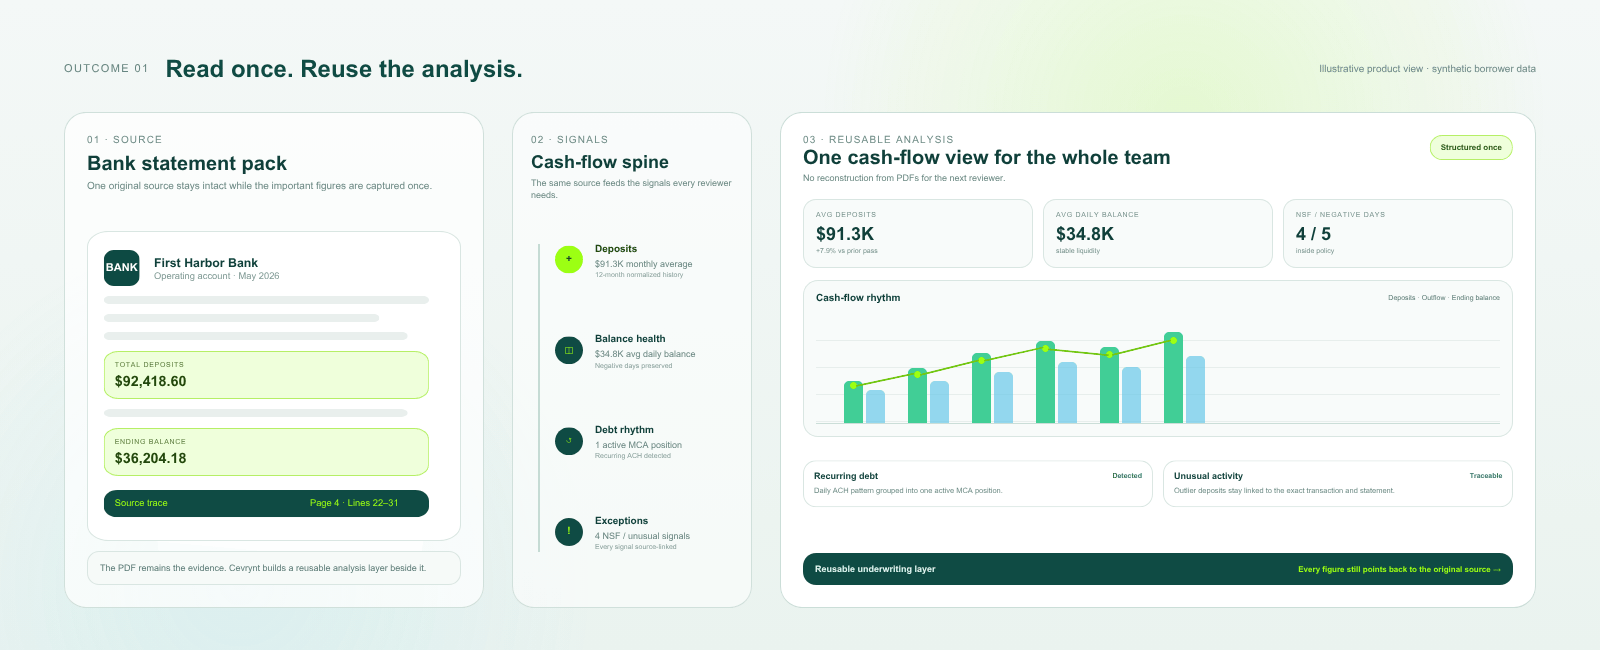
Cevrynt's Bank Statement Analysis module structures deposits, balances, NSF activity, and transaction patterns into a consistent format across every deal, with every figure linked back to its source transaction. Underwriters see cash-flow trends, existing debt service, and stress signals side by side, in the context of the lender's own policy thresholds — not as a generic score, but as evidence they can inspect and act on.
This feeds directly into the rest of the underwriting workflow, alongside business verification and fraud signals, so a deal's full financial picture stays connected rather than scattered across separate tools. A qualified walkthrough is the best way to see this against your own file mix.