
Ask any experienced MCA underwriter which numbers they look at first, and a few terms come up consistently: average daily balance, debt service coverage, and deposit consistency. These metrics are foundational to alternative lending underwriting, but they're often used loosely in conversation without a shared, precise definition — which makes it harder for underwriting and risk teams to compare notes, and harder for a lender evaluating a new tool to know exactly what they're getting.
This piece defines each metric plainly, explains how it's typically calculated, and covers where it can mislead if used without context.
Average daily balance (ADB)
Average daily balance is calculated by summing the account balance at the end of each day over a period and dividing by the number of days in that period. It gives a sense of typical operating cushion, distinct from total revenue or deposit volume.
A business can have strong monthly deposits but a low ADB if money moves through the account quickly — paid out to suppliers, payroll, or existing debt almost as fast as it comes in. This is why ADB is often reviewed alongside deposit volume rather than as a standalone figure: the two together tell a fuller story than either alone.
Where ADB can mislead
A single large deposit near the end of a lookback period can temporarily inflate ADB in a way that doesn't reflect the business's typical operating pattern. Reviewing the daily balance trend over the full period, rather than just the average, helps catch this kind of distortion.
Debt service coverage (DSCR)
Debt service coverage ratio measures available cash flow relative to debt obligations — broadly, how many times over a business's operating cash flow could cover its existing and proposed debt payments. A DSCR comfortably above 1.0 suggests cash flow adequately covers obligations; a ratio near or below 1.0 suggests the business would be operating with little or no margin.
In MCA underwriting specifically, calculating a meaningful DSCR requires accurately identifying existing debt obligations from bank statement activity — which is often harder than it sounds, since existing MCA payments don't always show up with an obvious label. This connects directly to the debt-service identification challenge covered in our guide to cash flow underwriting.
Where DSCR can mislead
DSCR is only as accurate as the debt-service figure feeding into it. Missing an existing MCA position — a common risk discussed in our piece on detecting stacking — will overstate DSCR and understate true risk. This is one of the more consequential blind spots in manual bank statement review.
Deposit consistency
Deposit consistency measures how stable a business's incoming deposits are across the lookback period, rather than just the average level. This is often expressed as a variance or coefficient of variation across monthly or weekly deposit totals. Two businesses with identical average monthly deposits can have very different consistency profiles — one steady, one highly volatile — and that difference matters for assessing repayment reliability.
Where deposit consistency can mislead
Genuinely seasonal businesses will show variance that looks like inconsistency in a naive calculation, even though the pattern is predictable and normal for that industry. Distinguishing seasonal variance from genuine instability requires either enough historical data to see the cycle repeat, or industry-specific context built into the analysis.
Calculating factored revenue and the advance-to-revenue ratio
Two additional metrics appear frequently in MCA underwriting conversations alongside ADB and DSCR: factored revenue (also called net revenue after existing MCA deductions) and the advance-to-revenue ratio. Factored revenue deducts the existing daily MCA repayment obligations from gross deposit volume to arrive at what is actually available to the business — the number that more accurately represents usable cash flow rather than total inflow.
The advance-to-revenue ratio expresses the proposed advance amount as a multiple of monthly deposit volume. An advance equal to one month of deposits is typically considered moderate; two or more months of deposits can signal that the repayment burden will be significant relative to the business's operating cash flow. Different lenders draw their thresholds in different places, but the ratio gives a rapid first-pass sense of whether the size of the proposed deal is within a range that the business's revenue can plausibly support.
How the lookback period choice affects every metric
ADB, DSCR, and deposit consistency are all sensitive to the lookback window used to calculate them. A three-month lookback captures recent conditions most accurately but can be skewed by a single unusual month — a large contract payment, a seasonal peak, or a one-time expense. A six-month lookback smooths out these anomalies but can dilute genuinely important recent trends, like a business that has been declining for four months but performed well in months five and six.
Many underwriting policies address this by running calculations over multiple windows and comparing them — looking at three-month versus six-month ADB, for example, to see whether the trend is improving, stable, or deteriorating. A three-month ADB that's meaningfully lower than the six-month ADB suggests the business's cash position has been weakening recently, which may be more credit-relevant than the longer-term average. This comparison requires consistent methodology, since the value of comparing windows depends entirely on the metrics being calculated the same way across both periods.
What these metrics look like for Cedar and Stone LLC
To make these metrics concrete, consider how they'd apply to Cedar & Stone LLC, the illustrative deal used throughout Cevrynt's product examples. Cedar & Stone is a small general contractor with average monthly deposits of $68,000 spread across three months of statements. Their ADB over that period is $14,200 — lower than the deposit volume would suggest, because payroll and supplier payments cycle through quickly after each deposit.
An existing MCA position pulls approximately $850 per business day, totaling roughly $17,000 per month. Factored revenue is $68,000 minus $17,000, or $51,000 available for operations and new debt service. A proposed new advance carrying a $700 daily payment adds another $14,000 per month, bringing total MCA obligations to $31,000 — 45.6% of gross deposits committed before any other operating expenses. DSCR for the proposed position would be approximately 0.88 against the factored revenue, suggesting the business's free cash flow may not comfortably support the additional advance without some compression in operating expenses or deposit growth.
This is a simplified illustration. Cevrynt does not make the funding decision for Cedar & Stone — that judgment belongs to the underwriter and lender. But the numbers surface a specific tension that deserves underwriter attention before approval.
Using these metrics together
None of these three metrics should be evaluated in isolation. A business with strong ADB but poor deposit consistency, or healthy DSCR but a deteriorating balance trend, presents a different risk picture than the headline number for any single metric would suggest. This is precisely why decision-intelligence workflows aim to present these metrics together with context, rather than reducing them to a single blended score that hides the underlying tension between them.
Setting thresholds that match your credit policy
These metrics don't come with universal pass/fail thresholds. What constitutes an acceptable ADB, DSCR, or deposit consistency score for one lender may differ meaningfully from another, depending on their product terms, advance sizes, repayment structures, and the borrower segments they serve. A lender focused on large-ticket, longer-term deals to established businesses will set different floors than one writing small, short-cycle advances to early-stage restaurants or retail operations.
The implication for teams building or refining underwriting criteria is that the primary value of these metrics isn't the threshold itself — it's the consistency of calculation. A DSCR threshold of 1.2x applied consistently across every file is far more useful than a nominally higher threshold that's calculated differently deal to deal, because consistent calculation lets a lender learn from their own performance data over time. Which files that breached threshold but got approved performed well? Which that cleared it underperformed? That feedback loop requires a denominator that means the same thing every time.
When these metrics conflict with each other
Experienced underwriters regularly encounter files where ADB, DSCR, and deposit consistency point in different directions. A restaurant with predictably strong holiday deposits and lean cash positions in January and February might show excellent DSCR in a November snapshot but a deteriorating ADB if the review window spans both seasons. A construction contractor might have choppy deposit consistency — payments arrive in large, project-completion lumps — while maintaining a healthy average balance because expenses don't spike the same way.
These conflicts are not data errors. They're where underwriting judgment earns its value. The right response is to document which metrics are in tension, what the likely explanation is (seasonal pattern, business model, one-time event), and how those factors affect the underwriter's assessment of repayment risk — not to pick the most favorable metric and proceed without acknowledging the others. A file with internally consistent metrics, even if they're all moderate, is often more creditworthy than one with a single standout number alongside several weak ones.
From here, this article is about Cevrynt
How Cevrynt calculates and presents these metrics
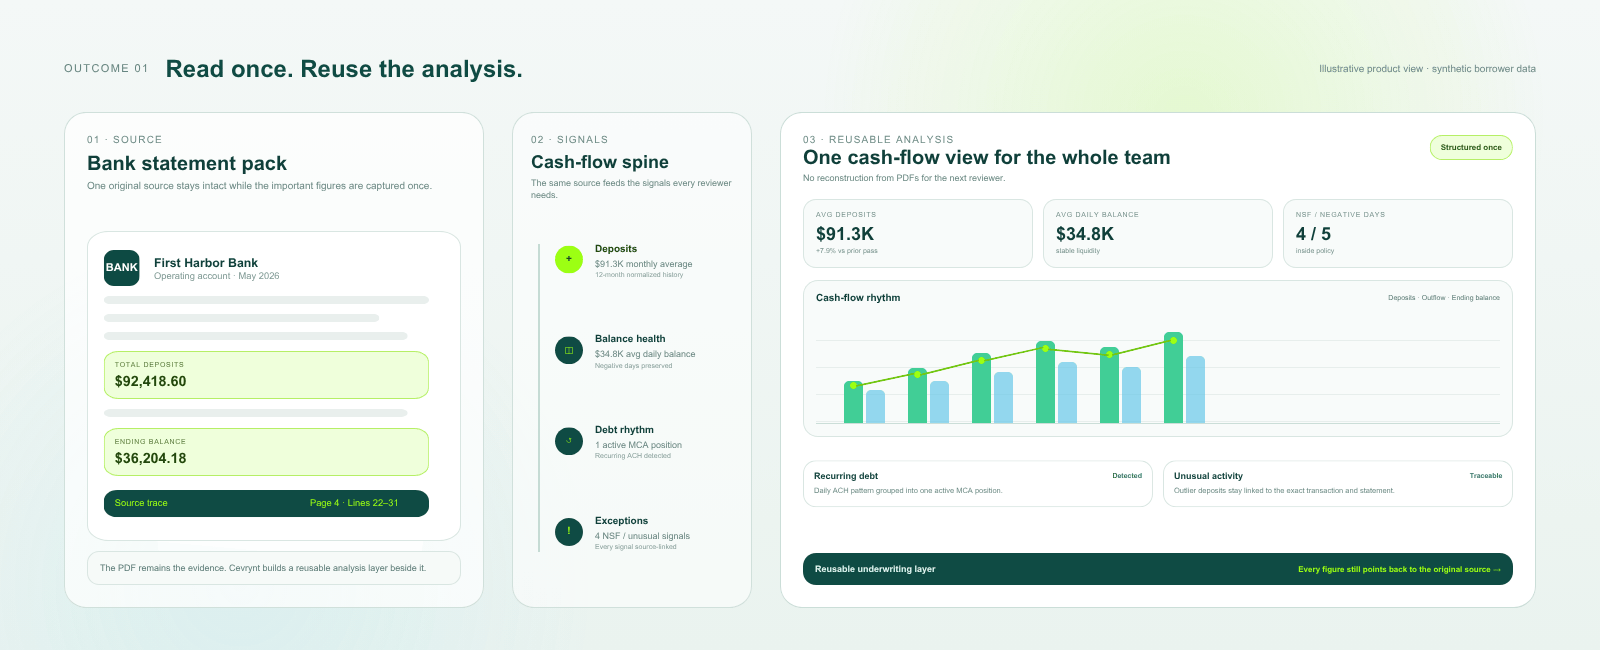
Cevrynt's Bank Statement Analysis calculates ADB, DSCR, and deposit consistency consistently across every deal, with existing debt obligations identified explicitly rather than folded silently into a single score. Every figure links back to the underlying transactions, so underwriters reviewing a merchant cash advance deal can see exactly how each metric was derived and where it might need a closer look.
These metrics are presented alongside NSF patterns, cash flow trends, and verification findings — part of one connected review, not a standalone calculator. A qualified walkthrough is the best way to see this against your own underwriting criteria.