
Bank statements vs accounting data for underwriting is not a contest. Bank statements prove what cash actually moved through the business account; accounting data shows what the business says it earned, owes and is owed. Sound cash-flow underwriting uses the bank as the anchor, uses the books to explain timing and obligations, and documents every variance between the two.
This guide compares the five evidence sources that show up in small-business credit files: bank statements and bank-data connections, accounting software data, tax returns, processor and marketplace payouts, and the revenue the applicant writes on the application. For each one it covers what it proves, what it cannot prove, how current it is, how easily it is manipulated and how to obtain it. It then walks through reconciliation, including accrual versus cash timing, transfers and loan proceeds, owner draws and seasonality, with a worked illustrative example and a variance table. It closes with which evidence to require for each product, what cash-flow underwriting software should show, and how to run a pilot on your own files. If you want the metrics themselves, such as average daily balance or DSCR, read our guide to core MCA underwriting metrics; this article is about the evidence underneath them.
What is the difference between bank statements and accounting data in underwriting?
Bank statements are records produced by a third party, the bank, showing cash that settled in an account on specific dates. Accounting data is produced by the business or its bookkeeper and records economic events according to an accounting method, which may recognize revenue long before or after the cash arrives.
That difference in authorship and in clocks explains most of what underwriters see in practice. A bank statement has no opinion about whether a credit is revenue. It shows that $18,400 arrived on the 12th from a named counterparty, and it shows the balance afterwards. The general ledger has an opinion about everything: it classifies the same receipt as payment of an invoice issued six weeks earlier, it records the invoice as revenue in the month it was issued, and it carries the unpaid portion of other invoices as accounts receivable.
The IRS describes the two basic methods plainly in Publication 538. Under the cash method, a business includes in gross income the items it actually or constructively received during the year. Under an accrual method, it generally reports income in the year it is earned, regardless of when payment is received. The publication notes that most individuals and many small businesses use the cash method, while certain entities, and businesses that must account for inventory, generally have to use accrual, subject to exceptions such as the small business gross receipts test. Books kept for management purposes do not always follow the tax method either, so ask which method the statements you received were prepared on.
So one business can produce two honest revenue figures for the same quarter that differ meaningfully. The bank answers: did money arrive, how regularly, and how much stayed? The books answer: what has the business earned but not collected, what does it owe, and what is its margin? Cash-flow based underwriting needs both, and most errors come from treating one source as if it answered the other's question.
What does each evidence source prove, and what can it not prove?
Each source proves one thing well and leaves gaps another source must fill. Bank data proves cash movement, accounting data explains timing and obligations, tax returns provide a filed annual baseline, processor payouts confirm card or platform sales, and self-reported revenue is a claim to test rather than evidence.
Bank statements and bank-data connections
- What it proves: that specific credits and debits settled in a specific account on specific dates, the running balance, returned items and overdrafts, recurring obligations such as other funders' debits, payroll and rent, and the rhythm of deposits.
- What it cannot prove: whether a credit is revenue, a transfer, a loan or an owner contribution; what is owed but unpaid; whether other operating accounts exist; or what the business earned in a period if customers pay late.
- Timeliness: monthly PDFs are typically 30 to 60 days stale by the time a file is reviewed. A live bank-data connection can return transactions up to the last day or two, and allows a refresh before funding.
- Manipulation risk: PDFs can be edited or fabricated, and real accounts can be dressed up with round-tripped transfers before an application. A data connection with the borrower's consent removes the edited-PDF risk but not the round-tripping risk.
- How to obtain: three to six months of statements for every operating account, or a read-only connection through an account aggregator the borrower authorizes. Request month-end statements, not screenshots or partial exports.
A note on bank-data connections and regulation: the CFPB's personal financial data rights rule, issued under Section 1033 of the Consumer Financial Protection Act in October 2024, is framed around consumers' data and the authorized third parties consumers choose. The CFPB opened a reconsideration of parts of it with an advance notice of proposed rulemaking in August 2025. Do not read the rule as a guaranteed right of access to a small business's account data; for business accounts, what an aggregator can retrieve depends on the bank, the aggregator's terms and the borrower's consent, and the regulatory picture may change. For the metrics statements produce, see the bank statement analysis guide; for tampering checks, see how to detect fake bank statements.
Accounting software data: P&L, balance sheet, AR/AP aging and general ledger
- What it proves: how management classifies its activity. The P&L shows revenue, cost of sales and operating expenses by period; the balance sheet shows receivables, payables, debt, accrued liabilities and equity; AR and AP aging show who owes the business, who it owes and how late each item is; the general ledger shows the entries behind every figure.
- What it cannot prove: that any of it happened. Books are only as good as the person keeping them, and an export from accounting software is a set of entries, not an independent record. Uncategorized transactions, suspense accounts and a missing bank reconciliation are common in small businesses.
- Timeliness: potentially the most current source if the books are kept up to date, and potentially the most stale if the bookkeeper closes the month late or only at year end. Check the date of the last bank reconciliation, not just the report date.
- Manipulation risk: high for exported reports and PDFs, which are easy to edit; lower for a direct read-only connection to the accounting system, though entries can still be backdated or reclassified before the connection is made.
- How to obtain: an interim P&L and balance sheet for the year to date and the prior year, AR and AP aging as of a recent date, and the general ledger detail if a variance needs tracing. Ask whether the figures are on a cash or accrual basis.
Tax returns
- What it proves: the gross receipts and deductions the business reported to the IRS for a full year, signed under penalty of perjury, and the entity's tax classification, which tells you which return form to expect.
- What it cannot prove: anything about the current year. A return for the prior year can be 10 to 22 months old by the time you read it, and it says nothing about seasonality within the year.
- Timeliness: the weakest of the five. Useful as a baseline and for growth or decline trends across two or three years.
- Manipulation risk: a PDF of a return is as editable as any other PDF. Verify against an IRS transcript where the deal size justifies it.
- How to obtain: copies of the last two or three filed business returns, plus a transcript request with the taxpayer's consent through the IRS Income Verification Express Service, which uses Form 4506-C and is open to lenders who enroll as participants.
Processor and marketplace payouts
- What it proves: gross card or platform sales, fees, refunds, chargebacks and reserves, and the net payout that should then appear as a bank credit. For marketplace sellers it also shows how much revenue depends on a single platform.
- What it cannot prove: non-card revenue such as checks, ACH from invoiced customers or cash, so for many service businesses it covers only a fraction of sales.
- Timeliness: usually very current, often daily, and available for long histories.
- Manipulation risk: low when pulled from the processor or platform directly; higher for spreadsheets or screenshots supplied by the applicant. Watch for payouts routed to an account you have not seen.
- How to obtain: processor statements for the same months as the bank statements, or a read-only report export. For marketplace and storefront sellers, see e-commerce merchant underwriting.
Self-reported revenue on the application
- What it proves: what the applicant or broker believes, or wants you to believe, the business earns. It is useful for routing and for testing consistency, and nothing else.
- What it cannot prove: anything on its own. It is often an annualized peak month, a figure that includes signed but unbilled work, or gross deposits including transfers.
- Timeliness: current by definition, and unverified by definition.
- Manipulation risk: the highest of the five, and not necessarily deliberate. Brokers sometimes round up; owners often quote bookings rather than collections.
- How to obtain: it is already on the application. Record the exact figure and the period it claims to cover so it can be compared like for like.
How do lenders combine transaction-derived revenue with self-reported revenue?
Lenders anchor on revenue derived from transactions, usually net revenue deposits from bank data, then express every other figure as a percentage variance from that anchor. Each variance gets a named cause, a tolerance set by credit policy, and a note when it falls outside the tolerance.
The same logic applies whether the comparison happens inside a lender's own workflow or inside a verification or data provider that returns a revenue estimate alongside the stated figure. Self-reported revenue is the claim. Transaction-derived revenue is the test. Accounting data and tax returns are the explanation for any gap, and processor payouts are a cross-check on a subset of the deposits. When a provider reports that stated revenue is far above observed deposits, the useful output is not the flag itself but the bridge: which deposits were excluded, why, and what other evidence explains the rest.
A practical reconciliation order looks like this:
- Establish gross deposits for every operating account in the window, and confirm the months are complete and consecutive.
- Classify every credit as revenue, transfer between own accounts, loan or advance proceeds, owner contribution, refund or reversal, or unknown. Unknowns go to a reviewer, not into revenue.
- Compute net revenue deposits for the window. This is the anchor.
- Match processor payouts to specific bank credits, and confirm gross processing volume less fees, refunds and reserves equals what landed.
- Bridge the books to the bank by adjusting accrual revenue for the change in receivables, customer deposits and sales tax collected over the same window.
- Compare the tax return on a monthly average basis, adjusted for seasonality, as a check on scale and trend.
- Compare the stated figure last, and record the variance, the likely cause and whether the applicant was asked about it.
Why don't bank deposits match booked revenue?
Deposits and booked revenue diverge mainly because of timing: under accrual accounting, revenue is recorded when invoiced or earned, while the bank records it only when the customer pays. The change in accounts receivable over the window is the bridge that explains most of the gap.
Consider a contractor that invoices a customer $24,000 in mid-August on 45-day terms. On an accrual P&L, August revenue includes the $24,000. If the customer pays in early October and the lender reviews July through September statements, that money never appears in the bank window. The P&L overstates cash collected in the window by $24,000, and the balance sheet shows receivables $24,000 higher at the end of the window than they would otherwise be. Nothing is wrong with either record. They are running on different clocks.
Receivables are the largest timing item, but not the only one. A short bridge from accrual revenue to expected revenue deposits usually covers these lines:
  Accrual revenue for the window (P&L)
- Increase in accounts receivable        (+ a decrease)
+ Increase in customer deposits / deferred revenue
+ Sales tax collected from customers     (if revenue is booked net of tax)
- Retainage withheld by customers        (common in construction)
- Card fees and refunds netted by the processor
= Expected revenue deposits

Compare with: net revenue deposits from bank data
Residual = unexplained difference -> note it, ask about it, or tolerate it per policy
Two cautions. First, the bridge only works if the P&L, the balance sheet and the bank cover the same dates; an interim P&L through the 15th compared with statements through month end will never reconcile. Second, a business on the cash method for its books should show booked revenue close to revenue deposits already. If a cash-basis P&L shows revenue well above net revenue deposits, timing is not the explanation, and the gap deserves a direct question.
What inflates or distorts bank deposits in cash-flow underwriting?
Gross deposits overstate revenue whenever non-revenue money lands in the account: transfers from other accounts the business or owner controls, proceeds of loans and advances, refunds and reversals, and owner contributions. Seasonality distorts in a different way, by making a short window unrepresentative of the year.
Transfers between the business's own accounts
A transfer from the business savings account or a second operating account is not revenue, but it looks like a deposit. Descriptions such as an online transfer from an account ending in four digits are the giveaway. Ask for statements on every account that sends money in; if the sending account also receives revenue, you need it in the analysis anyway. Repeated round-trips between two accounts in the weeks before an application are a red flag worth raising with the fraud signals review.
Loan and advance proceeds
Proceeds from another funder, a term loan, a credit line draw or a credit card cash advance all inflate deposits and, more importantly, usually come with new debits a few days later. Proceeds tell you the business has other obligations; the debits that follow tell you their size and frequency. Identifying them is the core of detecting stacking, and the debits feed debt service coverage. Accounting data helps here: the balance sheet should list the liability, and if it does not, the books are incomplete or the debt is held personally.
Refunds, reversals and returned items
A vendor refund, an insurance payout, a returned payment that is redeposited, or an ACH that is reversed and re-sent can each create credits that are not sales. Redeposited items count twice if no one nets them. Returned items and overdrafts are a separate signal covered in our guide to NSF patterns.
Owner contributions and owner draws
Owner money moves in both directions and the two records treat it differently. A capital injection from the owner's personal account is a bank credit but not revenue, and it should appear in equity on the balance sheet. Owner draws are the reverse problem. For many pass-through entities, distributions to owners are recorded in equity rather than as expenses, so P&L net income can look healthy while the owner is taking out most of the cash. The bank shows the draws plainly. When you assess capacity to repay, use cash left after draws, or agree with the owner what level of draws continues after funding, rather than P&L net income alone.
Seasonality and lumpy contracts
A three-month window from a landscaper's summer or a retailer's holiday season will overstate the annual run rate; the same window from the off-season will understate it. Tax returns and a 12-month P&L help here, because they cover the full cycle. Contract businesses add lumpiness: one large milestone payment can dominate a month. Rather than averaging it away, show the window with and without the largest single deposit, and check whether that customer appears in AR aging for future payments. The cash flow underwriting guide covers how industry context changes what normal looks like.
Worked example: reconciling Cedar & Stone LLC across every source
In this illustrative example, every source for one small contractor is reconciled to net revenue deposits. Two variances matter: accrual revenue runs 8 percent above the bank because receivables grew, which is explained, and stated revenue runs 24 percent above the bank, which needs a documented answer.
Cedar & Stone LLC is the illustrative general contractor we use across Cevrynt's examples; it does not represent a real borrower. It submits three months of statements for one operating account covering its busy summer season, an accrual-basis P&L and balance sheet for the same months, AR aging at the start and end of the window, statements from the card processor it uses for smaller residential jobs, last year's business return and an application stating annual revenue of $900,000.
Source                                   3 months    Monthly   vs bank net
---------------------------------------  ----------  --------  -----------
Gross bank deposits                       $204,000   $68,000     +12.4%
  less transfer from business savings     -$12,000
  less owner capital contribution          -$8,000
  less supplier deposit refunded           -$2,500
Net revenue deposits (anchor)             $181,500   $60,500    baseline
Processor payouts (inside deposits)        $21,300    $7,100   11.7% of anchor
  processor gross volume $22,000, fees $700 -> payouts $21,300 (ties)
P&L revenue, accrual                      $196,000   $65,333      +8.0%
  less increase in AR ($41,000 -> $54,300) -$13,300
P&L revenue less AR increase              $182,700   $60,900      +0.7%
Prior-year tax return, gross receipts     $690,000/yr $57,500     -5.0%
Application, stated annual revenue        $900,000/yr $75,000    +24.0%
Owner draws (bank debits, not on P&L)      $18,000    $6,000        n/a
Reading the table line by line:
- Gross deposits overstate revenue by 12.4 percent. Three credits are not sales: a transfer from the business savings account, an owner contribution that appears in equity on the balance sheet, and a refunded supplier deposit. Each is identified from the transaction description and confirmed against the books.
- Processor payouts tie. Gross card volume less fees equals the payouts, and every payout matches a bank credit. Card sales are only about 12 percent of revenue, so the processor confirms a slice of the business, not its scale.
- Accrual revenue is 8.0 percent above the anchor, and the bridge explains it. Receivables rose by $13,300 during the window, consistent with a busy season billed on 30- to 45-day terms. After the adjustment the books are within 0.7 percent of the bank.
- The $1,200 residual has a cause. The bookkeeper recorded one customer payment on the last day of September; it cleared the bank in early October. The file notes it and moves on, because it is well inside a reasonable tolerance and the cause is specific.
- The tax return is 5 percent below the summer anchor, which is what you would expect if the business is roughly flat to modestly growing and this window is its strongest season. A return far below the anchor would raise a question about whether the window is representative.
- The stated figure is 24 percent above the anchor. The likely cause is that the owner annualized booked work, including signed contracts not yet billed. That may be a real pipeline, but it is not revenue. The variance is recorded with the owner's explanation and the reviewer's note, and the stated figure plays no part in sizing.
- Owner draws of $6,000 a month do not appear on the P&L because they are distributions. They come out of the same cash that would service any new obligation, so the capacity view uses cash after draws.
The output of this reconciliation is not a decision. It is a defensible revenue figure, a list of explained and unexplained variances, and a short set of questions for the applicant. The underwriter then applies the lender's own policy to that evidence. For how the same file looks through ADB and coverage metrics, see the Cedar & Stone metrics walkthrough.
Which evidence should you require for MCA, revenue-based finance, term loans and lines of credit?
Bank data is the core evidence for every product. Merchant cash advance and revenue-based finance lean on bank and payout data because repayment follows receipts, while working-capital term loans and lines of credit add accounting statements, receivables aging and tax returns because repayment depends on margin, obligations and collateral.
Merchant cash advance
Merchant cash flow underwriting for an advance rests on bank data: net revenue deposits, balance behavior, existing funder debits and returned items over three to six months. Processor statements matter when remittance is a split of card receipts or when card sales are a large share of revenue. Accounting statements and returns are usually requested only for larger amounts, for renewals that are growing quickly, or when the bank picture leaves a question the books can answer, such as whether a deposit spike was a one-off contract. See the merchant cash advance solution for how this fits an MCA workflow.
Revenue-based finance
Because repayment is a share of receipts, the receipts themselves are core: bank data plus processor, platform or subscription-billing payouts, which show refund rates, churn and concentration in a way deposits alone cannot. For subscription businesses, the accounting view of deferred revenue and recurring revenue often matters more than the P&L headline. Our comparison of revenue-based financing and term loans covers how the repayment structure changes the questions.
Working-capital term loan
Cash flow underwriting for working capital loans with fixed payments depends on margin and existing obligations, not just receipts. The P&L and balance sheet are core, because coverage is calculated on earnings after operating costs and the balance sheet lists other debt. Tax returns provide the filed multi-year baseline. Bank data remains the check that the books describe a real business with cash that actually arrives, and AR aging shows whether booked revenue is being collected.
Line of credit
Revolving credit adds a question the other products do not: will the business keep generating the receivables or cash that supports its limit? AR and AP aging become core, especially where the limit is tied to a borrowing base, and many lenders ask for them again periodically during the life of the line. The balance sheet shows working capital and other liabilities, and bank data shows how the line is actually used, including whether draws are funding operations or covering other debt.
What should cash-flow underwriting software show from bank and accounting data?
Cash-flow underwriting software should show every revenue figure with its source and its bridge: which deposits were counted, which were excluded and why, how the books reconcile to the bank, and which variances fall outside policy tolerance. A single blended revenue number with no lineage is the main thing to avoid.
The same requirements apply whether you buy or build. Our article on bank statement analysis software vs an underwriting platform covers scope; this list covers what the reviewer should see.
- Both clocks side by side. Net revenue deposits and booked revenue for the same window, by month, with the receivables change between them. Never one replacing the other.
- Credit classification with reasons. Each excluded credit labelled as transfer, loan proceeds, owner contribution or refund, with the rule or reviewer that classified it, and the ability to override with a note.
- Source links on every number. Clicking a monthly total should reach the underlying transactions and the statement page they came from. This is what source-linked extraction means in practice.
- A visible reconciliation bridge. Accrual revenue to expected deposits, line by line, with the residual stated rather than hidden.
- Variance flags driven by your policy. The tolerance for stated-versus-observed revenue or books-versus-bank should come from your credit policy, not a vendor default, and a flag should route to a person rather than decline a file.
- Completeness checks. Missing months, missing accounts referenced by transfers, statements that do not chain from one closing balance to the next opening balance, and books whose last bank reconciliation is old.
- Seasonality context. The window marked against a longer view where one exists, such as a 12-month P&L or prior returns, so a peak quarter is not annualized silently.
- Obligations from both sides. Recurring debits found in the bank compared with liabilities on the balance sheet, with mismatches surfaced for review.
- An audit trail. Who changed a classification, when, and why, preserved with the file.
Warning signs when you evaluate a product: revenue shown only as a single figure; exclusions that cannot be inspected; accounting data imported but never compared with the bank; and automated outcomes that cannot be traced to evidence. The underwriting report a reviewer signs should carry the reconciliation with it, not just its conclusion.
How do you run a cash flow underwriting pilot on your own files?
Run a cash flow underwriting pilot on closed files whose outcomes you already know, define success criteria before you start, and compare the tool's reconciliation with your own reviewers' work file by file. The goal is evidence about your files and your policy, not a vendor's headline figure.
- Write the question down. For example: does this software classify credits and reconcile books to bank in a way our reviewers agree with, and does it surface the variances our policy cares about? A pilot without a written question ends in impressions.
- Choose a representative sample of your own files. Include straightforward deals, declined deals, renewals, files with known problems such as stacking or tampered statements, and files that had accounting data as well as statements. Include your awkward industries, not just the clean ones.
- Freeze your ground truth first. For each file, record the net revenue figure, exclusions and variances your reviewers settled on, before the tool sees the file. Otherwise the comparison drifts towards whatever the tool says.
- Agree the data handling. Borrower files contain personal and financial data. Settle the agreement, access controls, retention and deletion at the end of the pilot before any file moves.
- Measure what matters to you. Agreement on net revenue deposits within your tolerance, exclusions the tool missed or wrongly made, variances it surfaced that reviewers missed, how often reviewers overrode its classifications, and how long your own team spent reaching a decision-ready file with and without it. Measure your own times; do not adopt someone else's.
- Review disagreements, not averages. The files where the tool and the reviewer disagree tell you more than a summary score. Classify each one: tool wrong, reviewer wrong, or policy unclear.
- Set exit criteria in advance. Decide what result means proceed, extend or stop before you see the results, and record who decides.
Two pitfalls are common. Pilots that only use clean files overstate how well any tool performs, because the hard part of reconciliation is the messy file. And pilots that change the credit policy midway cannot separate the tool's effect from the policy's. Keep the policy rules fixed for the duration, and log any exception the way you would in production. Our pilot page describes how a scoped evaluation with Cevrynt is set up.
From here, this article is about Cevrynt
How Cevrynt approaches bank and accounting evidence
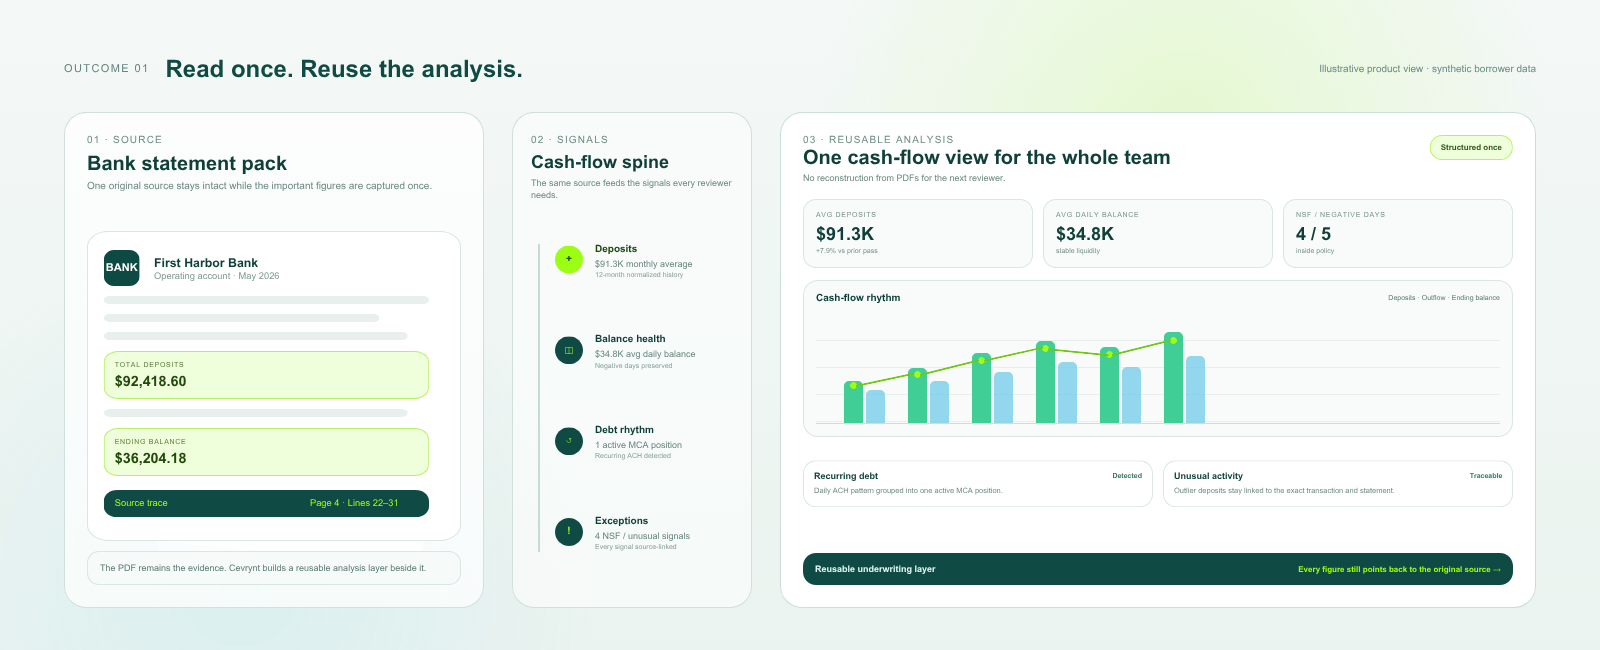
Cevrynt is AI-assisted underwriting infrastructure for alternative lenders, including MCA funders and revenue-based finance companies. Its Bank Statement Analysis structures deposits, balances and transactions into cash-flow analysis, and Document Intelligence extracts figures from the financial documents a borrower submits with links back to the source page, so a reviewer can see which credits were counted, which were excluded and why, and challenge any of them.
Variances between sources are presented as findings for the underwriter, alongside business verification, fraud signals and the lender's own policy rules, and they are carried into an evidence-linked report with reviewer notes and overrides. Cevrynt is not a lender, does not fund deals and does not decide files; offers come from the lender's own terms and go out only when the lender decides, and the lender's underwriters keep final authority. To see how this works for your products, read about our work with alternative lenders or book a walkthrough.